Analytics & Insights
Understand your event better with data and insights
It's hard to know if the event is on track without seeing the full picture. How many guests confirmed? Are we on budget? What's the overall status?
Easy Events' analytics dashboard shows all your event metrics at a glance with visual charts. See RSVP breakdowns, budget status, task progress, and special requirements in one place.
What can you do?
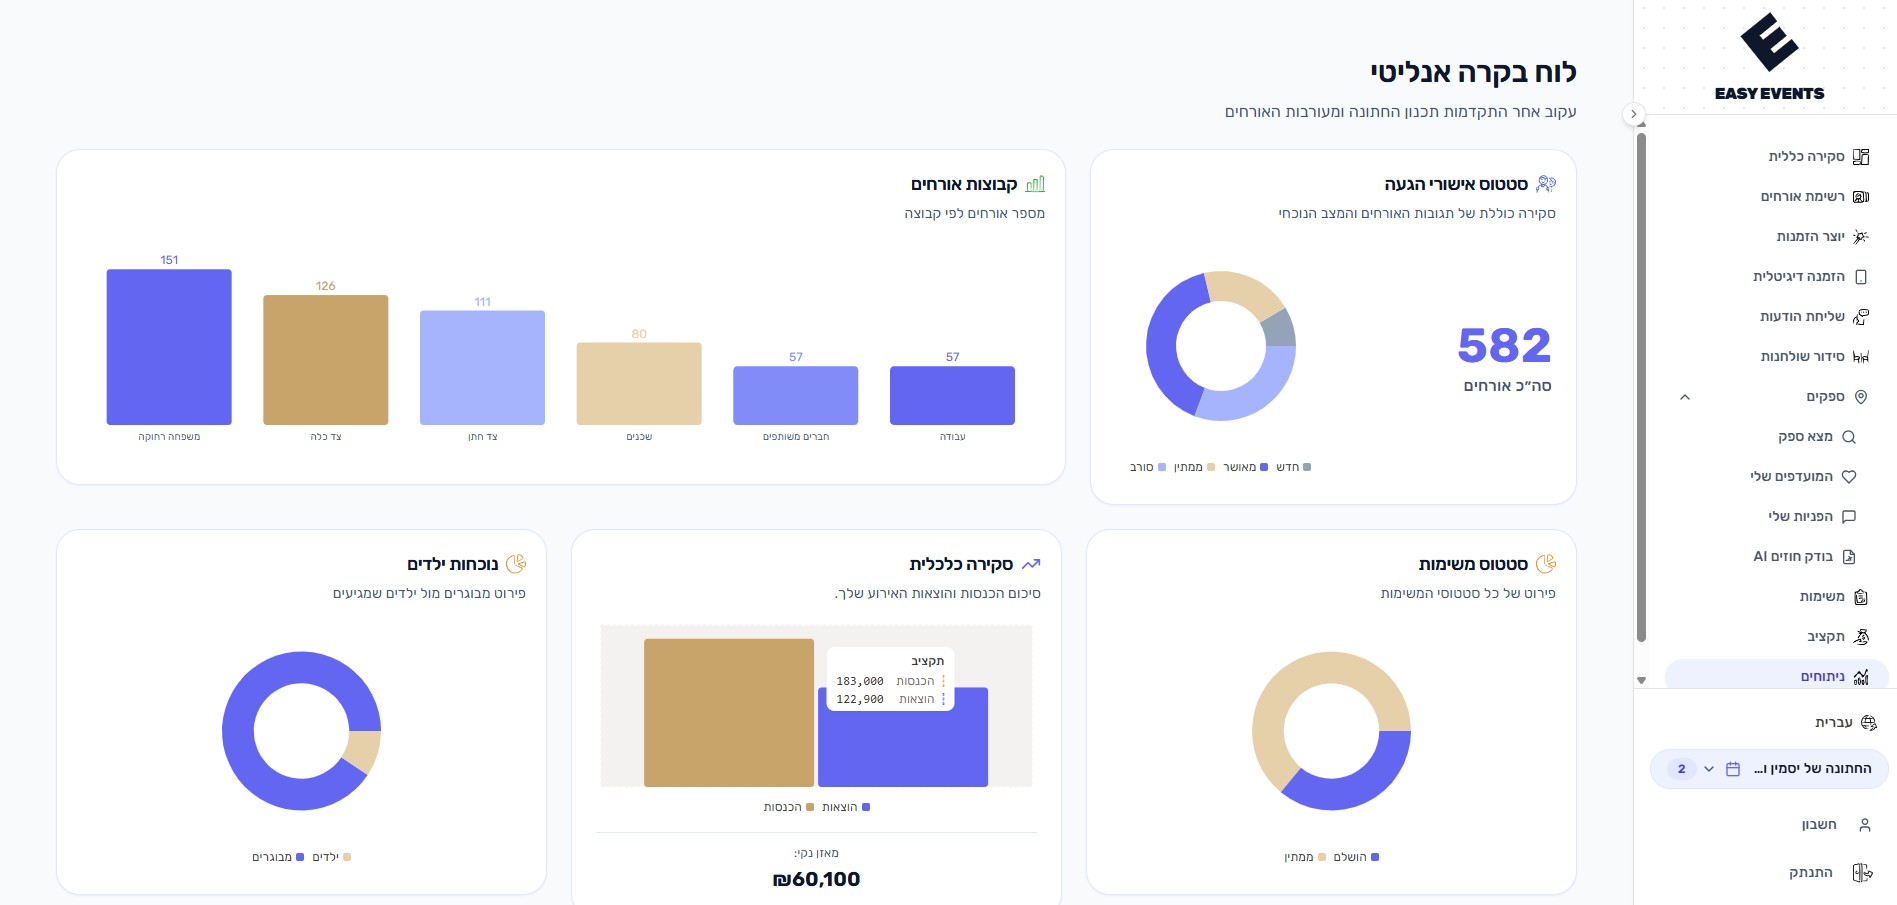
- View RSVP status breakdown with donut charts
- See guest distribution by groups (bride's side, groom's side, etc.)
- Track adults vs. children ratio among confirmed guests
- Monitor special meal requirements (vegetarian, vegan, gluten-free)
- Analyze transportation needs by pickup location
- View income vs. expenses with bar charts
- See task completion progress
- Read guest notes and special requests at a glance
- Transportation chart - visual breakdown of transportation needs by pickup location
- Click any card to navigate directly to that section
Insights you'll get
- Total confirmed guests with adults/children breakdown
- RSVP response rate and pending confirmations
- Budget usage and net balance
- Task completion percentage
- Dietary requirements summary
- Transportation logistics by location
Tips & Best Practices
Check analytics weekly to catch issues early
Use RSVP data to time your reminder messages
Share special meals data with your caterer
Review guest notes before finalizing arrangements